What is a Monte Carlo Simulation?
DEAL with Uncertainty
The Monte Carlo simulation is a technique to visualize uncertainty and therefore enables you to make right decisions.
Imagine that a new product should be launched. You define in advance
which variables (or better drivers) influence the success of the product and assign them a concrete value in the spreadsheet. Let us assume that the demand growth in a given year is between -3% and
+ 3%. In the most likely case you expect a growth rate of +2%, which is
entered in the spreadsheet. The possible cases between -3% and +3% reflect uncertainty. You can not say with confidence or certainty that the growth rate will be exactly +
2%.
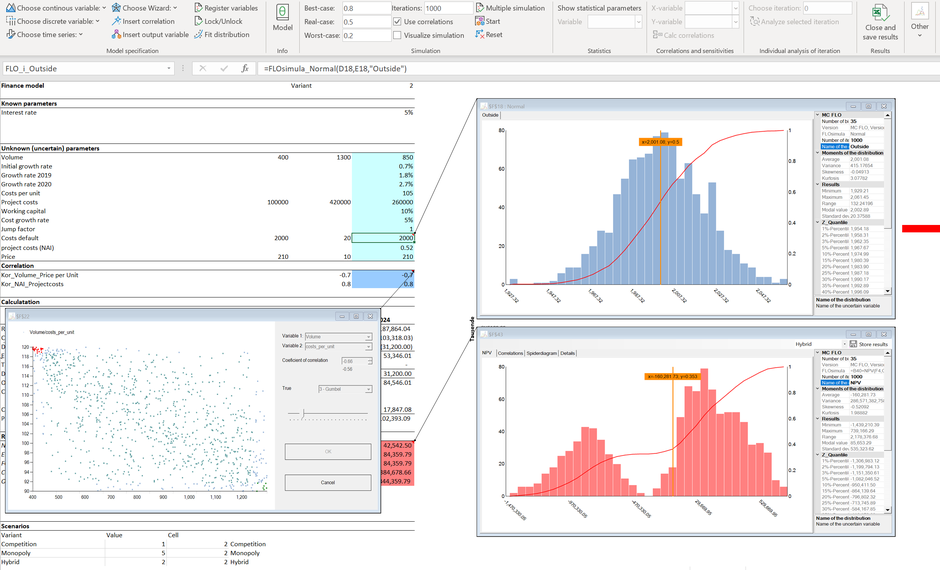
This is exactly where the Monte Carlo simulation with MC FLO comes in. You define in advance how the uncertain variables can behave by choosing effortlessly from a variety of
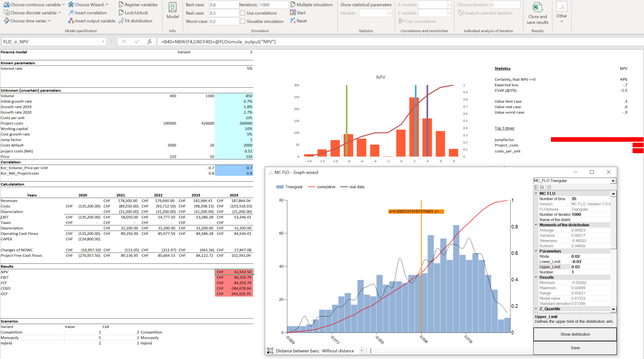
possible distributions. For example you may choose the normal distribution, the PERT distribution or, as shown in the picture above, the triangular distribution. If you already have data from the
past and want to use it for your calculations, you can use the built-in estimator to select a suitable distribution or you can use directly the past data. With MC FLO you even have the
opportunity to select time series for forecasts.
A Monte Carlo simulation with MC FLO selects in continuation computer-aided and directly in the Excel spreadsheet hundreds or thousands of times an allowable value from the predefined
distribution function (say + 1.97%) and calculates automatically the associated result (such as the profit).
As a result, you not only get a single value ("point estimate"), but a variety of possible values ("bandwidths"), from which you can then make an informed decision.
The technique of Monte Carlo simulation is applicable to almost all
areas of daily life. Whether it's project
cost, finance, R & D, manufacturing or corporate planning - wherever uncertainty takes place.
ConsideR Relationships
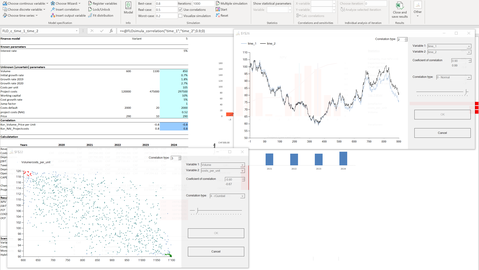
Very often it happens that the variables are not independent but are related to each other. So there can be a negative relationship (or correlation) between the price and the sales volume: if the price of a product is lowered, a demand increase for that product can be observed. You can not map these relationships in a pure Excel spreadsheet. Monte-Carlo simulation programs such as MC FLO allow you to incorporate these relationships into your model in a highly automated manner and thus into the Excel spreadsheet. This enables the most accurate mapping of the future states.
Make the right decisions
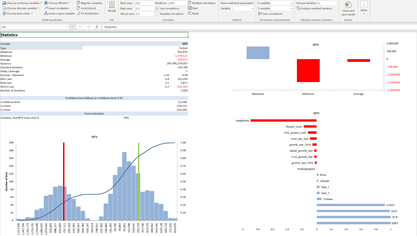
The result of a Monte Carlo simulation is a distribution of the possible values. Transparently shown are the values that are unlikely and those that can be considered highly probable within a certain range. Using a Tornado Graph in Excel, with MC FLO you will be able to see which variables significantly influence the desired result (such as the profit) and which do not. In this way, you can focus on the essential factors and thus make the right decisions. MC FLO also offers you the option to define possible scenarios (such as best, worst, real) easily.
MC FLO allows you to load the data from each iteration directly into the model. In this way you can seamlessly understand the calculation. By exporting all variables and the results in an Excel workbook, you have guaranteed maximum transparency.
Perform easily forecasts in your model with one click: all marked series (revenues, costs etc.) will be assigned automatically to a time series process and a forecast will be done considering the required confidence level.